
Original Research
Predictors of Patient-Related Cancellations and No-Shows for Pediatric Orthopaedics and Sports Medicine Appointments Are Condition Specific
Department of Orthopaedic Surgery and Sports Medicine, Boston Children’s Hospital, Harvard Medical School, Boston, MA
Correspondence: Grant D. Hogue, MD, Department of Orthopedic Surgery and Sports Medicine, Boston Children’s Hospital, Harvard Medical School, 300 Longwood Ave., Boston, MA 02115. E-mail: [email protected]
Received: October 7, 2022; Accepted: January 21, 2023; Published: May 1, 2023
Volume 5, Number 2, May 2023
Abstract
Background: Visit cancellations have detrimental effects on patient health and reduce clinic productivity. We sought to understand the factors that influence cancellation rates across the major subspecialties in pediatric orthopaedics and sports medicine (OSM).
Methods: In-person OSM visits from a high-volume multi-site academic pediatric hospital (01/01/2019-02/28/2020) were used to study the effect of patient demographics, distance to clinic, insurance type, visit type (new vs. follow-up) on visit cancellation (canceled by patient and no-shows). When available, chief complaint was used to categorize visits into major subspecialties: cerebral palsy, foot and ankle, hip, knee, other lower extremity, spine, and upper extremity. Logistic regression was used to identify contributors to the visit cancellations in a multivariate model.
Results: 424,397 visits (15.9% canceled) were included in the analysis. Based on the multivariate analysis, being non-white (OR=1.139), Hispanic (OR=1.133), older age (OR=1.007), female (OR=1.046), living farther from clinic (OR=1.002), and having public insurance (OR=1.163) were associated with higher cancellations, whereas median household income (OR=0.994, per $10,000) and new visit (OR=0.969) were associated with lower cancellations (P<0.04). 241,305 visits were categorized into subspecialties. The effects of studied patient-related factors and visit types on cancellations were highly variable across subspecialties. When significant, having public insurance and living farther from the clinic were consistently associated with higher rates of cancellations, while being a non-English speaker and having a new visit were associated with lower rates of cancellation. The remaining factors showed variable effects.
Conclusion: Disparities exist in patient-related visit cancellations in pediatric and young-adult OSM with different patterns across major OSM subspecialties. These findings highlight the importance of looking at these specific orthopedic conditions separately to develop more effective strategies to improve patient compliance and efficiently utilize healthcare resources.
Level of Evidence: Level III
Key Concepts
- Across all pediatric and young-adult OSM visits, being non-white, Hispanic, female, living farther from clinic, and having public insurance were associated with higher odds of cancellation.
- While disparities exist in patient-related visit OSM care, the factors that influence cancellation in specific subspecialties are varied and complex.
- Further research that looks at specific orthopedic conditions separately will improve efficiency and effectiveness of care and increasing patient compliance.
Introduction
Patient-related cancellations, or no-shows, can be detrimental to both the patients and the healthcare system, leading to inferior treatment outcomes, underutilizing medical resources, increasing healthcare costs, decreasing access to care, and reducing clinic efficiency and productivity.1,2 Furthermore, those missed appointments can lead to difficulties with rescheduling, subsequently self-propagating a pattern of poor adherence to scheduled appointment times and ability to access appropriate care.3 This then leads to worsening management of chronic diseases and later presentation for care.4,5 This is particularly important for pediatric and young adult care, as any untreated pathology or inferior outcomes, as a result of loss to follow-up, can lead to significant complications and chronic conditions in later adult life.
To effectively and systematically reduce patient-related cancellations, understanding the reasons and risk factors for why these cancellations occur is necessary. Prior literature on adult populations shows a plethora of reasons for missed appointments, including lower socioeconomic status (i.e., unemployed, having public insurance), prior history of cancellations, having to travel a longer distance to the clinic, having a higher BMI, being a current smoker, increased time between the actual visit and scheduling date, and scheduling problems.3,6–9 However, there has been very little work done on pediatric populations, and the literature is sparse on whether certain subspecialty clinics (e.g., spine, upper extremity) within orthopaedics and sports medicine vary in their rates of patient-related cancellations and no-shows and their relevant contributors. A study done for pediatric orthopaedic-related visits demonstrated that having public insurance and a longer duration of time between scheduling and the appointment were associated with higher rates of no-show.10 However, that study offered limited information on how these factors vary across different subspecialties within pediatric orthopaedic care. In the current study, we utilize a large database of pediatric and young adults patients who received orthopaedic or sports medicine care in a high-volume multi-specialty clinic academic pediatric hospital to 1) understand the significant predictors of patient-related cancellations and no-shows for pediatric orthopaedic and sports medicine visits and 2) delineate whether the predictors of patient-related cancellations are different between major pediatric orthopaedics and sports medicine subspecialties of care.
We hypothesized that baseline patient characteristics (i.e., age, sex, race, speaking language), economic status (i.e., median household income and insurance), distance between residence and clinic, and visit type (i.e., new vs. follow-up) can influence the appointment cancellation and no-show, with similar trends seen across all major subspecialities of care.
Materials and Methods
Design and Data
This retrospective cohort study utilized data from pediatric and young adult patients seeking orthopaedic or sports medicine care at a high-volume academic children’s hospital with six orthopaedics or sports medicine clinics across Massachusetts (Boston Children’s Hospital). Funding source did not play a role in this investigation. Following IRB approval, data from all the in-person orthopaedic and sports medicine outpatient visits between 01/01/2019 to 02/28/2020 (prior to the COVID-19 pandemic) were acquired. Data included patient demographics (i.e., age at the time of visit, sex, race, speaking language, ZIP code), insurance type (i.e., public, private, no insurance, and international), type of visit (i.e., new or follow-up), reason for visit (i.e., chief complaint and reason for visit), and the status of the visit (i.e., complete, canceled by patient or provider, no-show). A custom-written program was used to calculate the direct distance between the patient’s residence (ZIP code) and the clinic location. This was done by calculating the direct distance based on latitude and longitude information. The 2019 U.S. Census database was used to estimate the median household income (in 2019 inflation-adjusted dollars) based on the residence ZIP code.
Using a detailed keyword-based classification, each visit was stratified to seven pre-determined subspecialty categories based on the documented chief complaint and reason for the visit: cerebral palsy, foot and ankle, hip, knee, other lower extremity, spine, and upper extremity. We used the cancellation reasons to stratify the canceled visits into those canceled by the clinic (i.e., “provider – avoidable cancellation,” “scheduling error,” “provider-unanticipated,” “currently inpatient”) and those canceled by patients or patient-related factors (i.e., “insurance issue,” “lack of transportation,” “patient,” “no-show”). We then removed all non-patient-related cancellations from the analysis. The patient-related cancellations and no-shows were grouped together for the analysis (canceled appointments).
Statistical Analysis
Quality of the obtained data was checked using graphs and summary statistics to remove duplicates and entry errors. We used logistic regression to identify the predictors of cancellations. The appointment status (i.e., completed vs. canceled) was defined as the binary dependent variable. Being non-white vs. white (binary), Hispanic vs. non-Hispanic (binary), having public insurance vs. private insurance (binary), new visit vs. follow-up visit (binary), English vs. non-English speaking (binary), direct distance from residence to the clinic (continuous), and median household income (continuous) were considered as independent predictors. Unavailable race, insurance, and language data were treated as missing data points. Patients with no or international insurance were excluded from the analysis. All predictors were entered into the multivariate model (to calculate the adjusted odds ratio (aOR). P <0.05 was considered statistically significant. Analysis was done on all visits and then repeated for each subspeciality of care. Visits with unspecific chief complaints and reasons for the visit (e.g., pain) were excluded from subspecialty analysis. For distance to the clinic, the OR was calculated for every 5 miles distance. For median household income, the OR was calculated for every $10,000 of annual household income. All P-values are two-sided. Analysis was done in SPSS (v27, IBM Corp).
Results
Study Population
A total of 424,397 in-person visits (15.9% canceled) were included in the analysis (Table 1). The chief complaints and reason for visit data were specific and available for only 241,305 visits, which were categorized as 28,262 cerebral palsy visits (9.9% canceled), 48,194 foot and ankle visits (10.4% canceled), 25,348 hip visits (11.9% canceled), 41,683 knee visits (12.7% canceled), 28,503 other lower extremity visits (9.3% canceled), 34,330 spine visits (12.0% canceled), and 34,985 upper extremity visits (8.9% canceled).
Table 1. Baseline Characteristics of the Cohort (N=424,397)
| Characteristic | |
|---|---|
| Age (years), mean ± SD | 15.2 ± 12.4 |
| Sexa | |
| Female, no. (%) | 229,677 (54.1%) |
| Male, no. (%) | 194,704 (45.9%) |
| Unavailable, no. | 16 |
| Non-Whitea | |
| Non-White, no. (%) | 80,128 (24.7%) |
| White, no. (%) | 244,802 (75.3%) |
| Unavailable, no. | 99,467 |
| Hispanica | |
| Hispanics, no. (%) | 32,254 (11.5%) |
| Non-Hispanics, no. (%) | 248,872 (88.5%) |
| Unavailable, no. | 143,271 |
| Speaking Languagea | |
| Non-English, no. (%) | 34,798 (8.4%) |
| English, no. (%) | 378,606 (91.6%) |
| Unavailable, no. | 10,993 |
| Insurancea | |
| Public, no. (%) | 126,204 (33.4%) |
| Private, no. (%) | 252,095 (66.6%) |
| Unavailable or International, no. | 46,098 |
| Residence Distance from Clinic (miles), mean ± SD | 60.3 ± 232.0 |
| Median Household Income ($), mean ± SD | 102,482.20 ± 39,673.80 |
| Visit Type | |
| New, no. (%) | 254,337 (59.9%) |
| Follow-Up, no. (%) | 170,060 (40.1%) |
| Visit Status | |
| Completed, no. (%) | 356,756 (84.1%) |
| Canceled, no. (%) | 67,641 (15.9%) |
aPercentage was calculated based on available data.
Age as a predictor of Visit Cancellations
Across all visits, increased age was associated with increased odds of patient-related cancellations (aOR 1.007, 95% Confidence Interval (CI) 1.005 to 1.008, P-value <0.001) (Figure 1). Increased age was also significantly associated with increased patient-related cancellations in foot and ankle (aOR 1.012, 95% CI 1.007 to 1.016, P-value <0.001), spine (aOR 1.02, 95% CI 1.015 to 1.025, P-value <0.001), and upper extremity visits (aOR 1.019, 95% CI 1.014 to 1.024, P-value <.001). However, in cerebral palsy visits, increase aged was associated with decreased odds of visit cancellation (aOR 0.985, 95% CI 0.977 to 0.994, P-value .001).
Figure 1. Age as a predictor of patient-related cancellations. Solid circles signify statistical significance, while the hollow circles are not statistically significant. Data represent adjusted odds ratio and 95% CI. CP: cerebral palsy, F&A: foot and ankle, LE: lower extremity, UE: upper extremity.

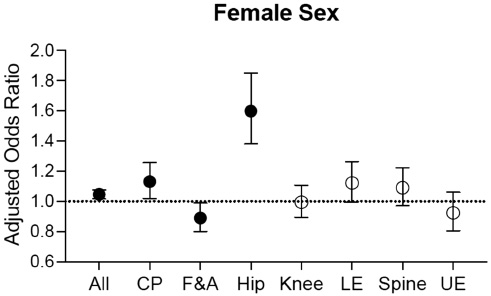
Sex as a Predictor of Visit Cancellations
Across all visits, female sex was associated with an increased odds of visit cancellation (aOR 1.046, 95% CI 1.016 to 1.077, P-value 0.003) (Figure 2). In the subspecialty analysis, female sex was associated with increased patient-related cancellations in cerebral palsy (aOR 1.131, 95% CI 1.019 to 1.256, P-value 0.02) and hip visits (aOR 1.599, 95% CI 1.381 to 1.852, P-value <0.001). In foot and ankle visits, female sex was significantly associated with a decreased odds of visit cancellation (aOR 0.89, 95% CI 0.801 to 0.989, P-value 0.031).
Figure 2. Sex as a predictor of patient-related cancellations. Solid circles signify statistical significance, while the hollow circles are not statistically significant. Data represent adjusted odds ratio and 95% CI. CP: cerebral palsy, F&A: foot and ankle, LE: lower extremity, UE: upper extremity.
Ethnicity and Race as Predictors for Visit Cancellations
Across all visits, being Hispanic was significantly associated with an increased odds of patient cancellation (aOR 1.133, 95% CI 1.075 to 1.193, P-value <0.001) (Figure 3). Being Hispanic was also associated with increased visit cancellations in knee visits (aOR 1.32, 95% CI 1.077 to 1.619, P-value 0.008), though was associated with decreased visit cancellations in foot and ankle visits (aOR 0.78, 95% CI 0.639 to 0.951, P-value .014).
Figure 3. Ethnicity as a predictor for patient-related cancellations. Solid circles signify statistical significance, while the hollow circles are not statistically significant. Data represent adjusted odds ratio and 95% CI. CP: cerebral palsy, F&A: foot and ankle, LE: lower extremity, UE: upper extremity.

Across all visits, being non-White was significantly associated with an increased odds of visit cancellation (aOR 1.139, 95% CI 1.096 to 1.184, P-value <0.001) (Figure 4). Being non-White was also significantly associated with increased patient-related cancellations in cerebral palsy (aOR 1.339, 95% CI 1.179 to 1.521, P-value <0.001), hip (aOR 1.484, 95% CI 1.252 to 1.759, P-value <.001), and lower extremity visits (aOR 1.451, 95% CI 1.264 to 1.666, P-value <0.001). However, being non-White was significantly associated with decreased visit cancellations in knee (aOR 0.778, 95% CI 0.67 to 0.903, P-value 0.001) and spine visits (aOR 0.82, 95% CI 0.696 to 0.968, P-value 0.019).
Figure 4. Race as a predictor for patient-related cancellations. Solid circles signify statistical significance, while the hollow circles are not statistically significant. Data represent adjusted odds ratio and 95% CI. CP: cerebral palsy, F&A: foot and ankle, LE: lower extremity, UE: upper extremity.

Household Income as a Predictor for Visit Cancellations
Across all visits, increased median household income was associated with lower odds of visit cancellation (aOR 0.994, 95% CI 0.99 to 0.998, P-value 0.004) (Figure 5). However, increased median household income was associated with increased patient-related cancellations in cerebral palsy (aOR 1.087, 95% CI 1.071 to 1.103, P-value <0.001), hip (aOR 1.049, 95% CI 1.031 to 1.068, P-value <0.001), and lower extremity visits (aOR 1.023, 95% CI 1.006 to 1.041, P-value 0.007).
Appointment Type as a Predictor for Visit Cancellations
Figure 5. Median household income as a predictor for patient-related cancellations. Solid circles signify statistical significance, while the hollow circles are not statistically significant. Data represent adjusted odds ratio and 95% CI. CP: cerebral palsy, F&A: foot and ankle, LE: lower extremity, UE: upper extremity.

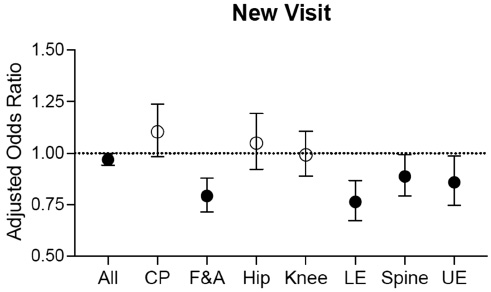
Across all visits, having a new visit was significantly associated with a decreased odds of patient-related cancellation (aOR 0.969, 95% CI 0.941 to 0.998, P-value 0.035) (Figure 6). Having a new visit was also significantly associated with decreased visit cancellations in foot and ankle (aOR 0.793, 95% CI 0.714 to 0.88, P-value <0.001), lower extremity (aOR 0.764, 95% CI 0.673 to 0.867, P-value <0.001), spine (aOR 0.887, 95% CI 0.794 to 0.992, P-value 0.036), and upper extremity visits (aOR 0.859, 95% CI 0.748 to 0.986, P-value 0.03).
Figure 6. Visit type as a predictor for patient-related cancellations. Solid circles signify statistical significance, while the hollow circles are not statistically significant. Data represent adjusted odds ratio and 95% CI. CP: cerebral palsy, F&A: foot and ankle, LE: lower extremity, UE: upper extremity.
Language as a Predictor for Visit Cancellations
Across all visits, being non-English speaking was associated with a decreased odds of patient-related cancellation (aOR 0.899, 95% CI 0.844 to 0.957, P-value 0.001) (Figure 7). Additionally, being non-English speaking was associated with decreased visit cancellations in hip (aOR 0.235, 95% CI 0.132 to 0.421, P-value <0.001), lower extremity (aOR 0.474, 95% CI 0.35 to 0.642, P-value <0.001), spine (aOR 0.627, 95% CI 0.451 to 0.873, P-value 0.006), and upper extremity visits (aOR 0.421, 95% CI 0.27 to 0.657, P-value <0.001).
Figure 7. Language as a predictor for patient related cancellations. Solid circles signify statistical significance, while the hollow circles are not statistically significant. Data represent adjusted odds ratio and 95% CI. CP: cerebral palsy, F&A: foot and ankle, LE: lower extremity, UE: upper extremity.

Insurance Type as a Predictor for Visit Cancellations
Across all visits, having public insurance was significantly associated with an increased odds of patient cancellation (aOR 1.163, 95% CI 1.125 to 1.202, P-value <0.001) (Figure 8). Additionally, having public insurance was significantly associated with increased cancellations in hip (aOR 1.26, 95% CI 1.09 to 1.458, P-value 0.002), and lower extremity visits (aOR 1.367, 95% CI 1.205 to 1.552, P-value <0.001).
Figure 8. Insurance type as a predictor for patient-related cancellations. Solid circles signify statistical significance, while the hollow circles are not statistically significant. Data represent adjusted odds ratio and 95% CI. CP: cerebral palsy, F&A: foot and ankle, LE: lower extremity, UE: upper extremity.

Distance From Clinic as a Predictor for Visit Cancellations
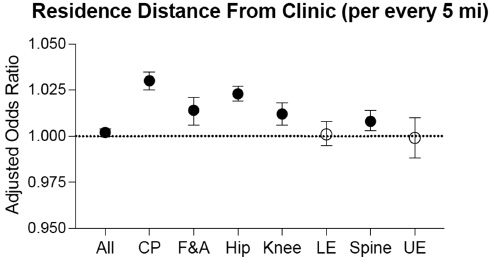
Across all visits, an increased residence distance from clinic was associated with an increased odds of patient cancellation (aOR 1.002, 95% CI 1.00 to 1.004, P-value 0.031) (Figure 9). Increased residence distance from clinic was also significantly associated with increased visit cancellations in cerebral palsy (aOR 1.03, 95% CI 1.025 to 1.035, P-value <0.001), foot and ankle (aOR 1.014, 95% CI 1.006 to 1.021, P-value <0.001), hip (aOR 1.023, 95% CI 1.019 to 1.027, P-value <.001), knee (aOR 1.012, 95% CI 1.006 to 1.018, P-value <0.001), and spine visits (aOR 1.008, 95% CI 1.003 to 1.014, P-value 0.002).
Figure 9. Residence distance from clinic as a predictor for patient related cancellations. Solid circles signify statistical significance, while the hollow circles are not statistically significant. Data represent adjusted odds ratio and 95% CI. CP: cerebral palsy, F&A: foot and ankle, LE: lower extremity, UE: upper extremity.
Discussion
The current study indicates that certain baseline and demographic characteristics as well as visit type (i.e., new vs. follow-up) can influence patient-related cancellations and no-shows. However, the factors and nature of their effects on cancellations were highly variable when investigated across all the visits vs. within major subspecialties. In general, insurance type, distance between residence and clinic, follow-up visits, and primary language spoken demonstrated the same effect across all subspecialties. When significant, having public insurance and living farther from the clinic were consistently associated with higher rates of cancellations while being a non-English speaker and having a new visit were associated with lower rates of cancellations The remaining investigated factors showed variable effects across the various subspecialties or when examined across all visits.
The observed effects of public insurance and residence distance to clinic were consistent with prior reports. Prior literature has demonstrated that patients who have public insurance have increased odds of having to reschedule visits, delay their visit, or experience more difficulty in obtaining appropriate care.11–13 A prior study for pediatric orthopedic visits also demonstrated that patients with public insurance had higher rates of no-show.10 Increased distance from the clinic has also been repeatedly associated with higher no-show rates.14,15 While, being non-English speaking has been suggested to be associated with inequities in care,16–20 in our study, the opposite effect of spoken language was surprising, and will warrant further investigation.
Most interestingly, in our study, the effect of baseline and demographics factors on cancellations occasionally varied in both magnitude (OR) and direction of the effect (OR changing from <1 to >1 or opposite) when examined in combination with other factors in the multivariate analysis. While changes in magnitude of the effect are expected across the various subspecialties, the change in the direction of the effect was an unexpected and important observation. For example, being non-White was associated with increased visit cancellations in some specialties (cerebral palsy, hip, and lower extremity), while associated with decreased cancellations in knee and spine visits. This finding suggests that complex interrelationships exist between these factors and how they affect the risk of cancellations. Moreover, the significance of a specific factor might vary based on several other factors, such as the disease process, or the different visit logistics dependent on subspecialty type.
While analysis on the overall visits indicate that all the studied factors are predictive of cancellations (multivariate analysis), the subset analysis across each subspecialty shows different predictors. This suggests that some predictors of the visit cancellations (e.g., age, sex, race, income, and visit type) can substantially vary between the various conditions and major subspecialties. Thus, a one-fits-all model may not be generalizable. These differences can be related to how these conditions affect patients of different ages, sex, and race differently.21–24 Additionally, the inconsistencies in income effect could be due to low resolution/accuracy of estimating incomes based on ZIP codes.25,26 Within a ZIP code, there could be a significant amount of heterogeneity in socioeconomic status and income levels which may have resulted in unaccounted variabilities in the estimated income levels and their effect on cancellations.27–29
This study is not without limitations. Though the study data was pooled from all clinics across the state, they all belong to a single institution. Thus, our study may potentially introduce population bias, which limits the generalizability of the findings. So, large-scale detailed analyses across other institutions are needed to gauge the generalizability of the current findings. Additionally, several other confounding factors may have influenced the current findings and could affect reasons for cancellation, including but not limited to access to transportation, time between scheduling and the appointment, family structure (e.g., parents vs. guardians), education level, and employment status. Unfortunately, this data was unavailable. Data regarding the timing of cancellation was also unavailable, though trends regarding cancellation timing would be interesting to analyze in future research. Finally, the smaller sample size for the subspecialty analyses may have influenced the results.
Conclusion
In summary, we demonstrate that disparities exist in patient-related visit cancellations and no-shows in pediatrics and young adults orthopaedics and sports medicine. Yet there were variabilities in the factors and their role in cancellation risk across the subspecialty analyses. This finding highlights the importance of looking at these specific orthopaedic conditions separately in order to develop more effective strategies to improve patient compliance. After all, a one-size-fits-all model does not fully capture the causality of OSM cancellations, as reasons for these cancellations are likely multifactorial and all the factors are yet to be delineated. These findings highlight the need for further in-depth and multi-center studies to better characterize disease-specific contributors to patient-related cancellations and no-shows. Such insight would help with improving patient care and efficient use of healthcare resources through development of targeted strategies (e.g., optimized and flexible scheduling, appointment reminders, transportation, use of telemedicine) aimed at increasing compliance.
Additional Links
- American Academy of Orthopaedic Surgeons (AAOS) Orthopaedic Video Theatre, Quality Improvement Principles and Models, Julie B. Samora, MD, PhD, MPH, FAAOS
- American Academy of Orthopaedic Surgeons (AAOS) Orthopaedic Video Theatre, Quality, Value, Variation in Orthopedics, Kevin G. Shea, MD
Acknowledgements
The authors would like to thank the Boston Children’s Hospital Research Computing and Innovation Digital Health Accelerator for assistance with data collection.
Disclaimer
Funding received from the Children’s Orthopedic Surgery Foundation (AMK) and Research Faculty Council at Boston Children’s Hospital (AMK). The authors report no conflicts of interest related to this manuscript.
References
- Huang Y, Hanauer DA. Patient no-show predictive model development using multiple data sources for an effective overbooking approach. Appl Clin Inform. 2014;5(3):836-860.
- Topuz K, Uner H, Oztekin A, et al. Predicting pediatric clinic no-shows: a decision analytic framework using elastic net and Bayesian belief network. Ann Oper Res. 2018;263(1):479-499.
- Lee SR, Dix DB, McGwin G, et al. Correlation of appointment times and subspecialty with the no-show rates in an orthopedic ambulatory clinic. J Healthc Manag. 2018;63(6):e159-e169.
- Kaplan-Lewis E, Percac-Lima S. No-show to primary care appointments: why patients do not come. J Prim Care Community Health. 2013;4(4):251-255.
- Lacy NL, Paulman A, Reuter MD, et al. Why we don’t come: patient perceptions on no-shows. Ann Fam Med. 2004;2(6):541-545.
- Briggs MS, Ulses C, Van Etten L, et al. Predictive factors for patients’ failure to show for initial outpatient physical therapist evaluation. Phys Ther. 2021;101(5):pzab047.
- Samuels RC, Ward VL, Melvin P, et al. Missed appointments: factors contributing to high no-show rates in an urban pediatrics primary care clinic. Clin Pediatr (Phila). 2015;54(10):976-982.
- Sharp DJ, Hamilton W. Non-attendance at general practices and outpatient clinics. BMJ. 2001;323(7321):1081-1082.
- Davies ML, Goffman RM, May JH, et al. Large-scale no-show patterns and distributions for clinic operational research. Healthcare (Basel). 2016;4(1):15.
- Robaina JA, Bastrom TP, Richardson AC, et al. Predicting no-shows in paediatric orthopaedic clinics. BMJ Health Care Inform. 2020;27(1):e100047.
- Su BM, Park JS, Chan DK. Impact of primary language and insurance on pediatric hearing health care in a multidisciplinary clinic. Otolaryngol Head Neck Surg. 2017;157(4):722-730.
- Jabbour J, Robey T, Cunningham MJ. Healthcare disparities in pediatric otolaryngology: a systematic review. Laryngoscope. 2018;128(7):1699-1713.
- Cheung DL, Sahrmann J, Nzewuihe A, et al. No-show rates to a sleep clinic: drivers and determinants. J Clin Sleep Med. 2020;16(9):1517-1521.
- Mieloszyk RJ, Rosenbaum JI, Hall CS, et al. Environmental factors predictive of no-show visits in radiology: observations of three million outpatient imaging visits over 16 years. J Am Coll Radiol. 2019;16(4 Pt B):554-559.
- Dantas LF, Hamacher S, Cyrino Oliveira FL, et al. Predicting patient no-show behavior: a study in a bariatric clinic. Obes Surg. 2019;29(1):40-47.
- Powers RJ, Mokdad AA, Pezzin LE, et al. Disparities in utilization of outpatient surgical care among children. Surgery. 2021;170(6):1815-1821.
- Kemp MT, Liesman DR, Brown CS, et al. Factors associated with increased risk of patient no-show in telehealth and traditional surgery clinics. J Am Coll Surg. 2020;231(6):695-702.
- Hensing WL, Poplack SP, Herman CR, et al. Racial differences in no-show rates for screening mammography. Cancer. 2021;127(11):1857-1863.
- Smith DF, Boss EF. Racial/Ethnic and socioeconomic disparities in the prevalence and treatment of otitis media in children in the United States. Laryngoscope. 2010;120(11):2306-2312.
- Caballero A, Muñoz K, White K, et al. Pediatric hearing aid management: challenges among hispanic families. J Am Acad Audiol. 2017;28(8):718-730.
- Bernatz JT, Tueting JL, Anderson PA. Thirty-day readmission rates in orthopedics: a systematic review and meta-analysis. PLoS One. 2015;10(4):e0123593.
- Tonelli M, Wiebe N, Manns BJ, et al. Comparison of the complexity of patients seen by different medical subspecialists in a universal health care system. JAMA Network Open. 2018;1(7):e184852.
- Sinclair ST, Emara AK, Orr MN, et al. Comorbidity indices in orthopaedic surgery: a narrative review focused on hip and knee arthroplasty. EFORT Open Rev. 2021;6(8):629-640.
- Oser FJ, Grimsley BM, Swinford AJ, et al. Variety and complexity of surgical exposure, operative autonomy, and program reputation are important factors for orthopaedic sports medicine fellowship applicants. Arthrosc Sports Med Rehabil. 2021;3(3):e855-e859.
- Thomas AJ, Eberly LE, Davey Smith G, et al. ZIP-code-based versus tract-based income measures as long-term risk-adjusted mortality predictors. Am J Epidemiol. 2006;164(6):586-590.
- Krieger N, Chen JT, Waterman PD, et al. Geocoding and monitoring of US socioeconomic inequalities in mortality and cancer incidence: does the choice of area-based measure and geographic level matter?: the Public Health Disparities Geocoding Project. Am J Epidemiol. 2002;156(5):471-482.
- Moss JL, Johnson NJ, Yu M, et al. Comparisons of individual- and area-level socioeconomic status as proxies for individual-level measures: evidence from the Mortality Disparities in American Communities study. Population Health Metrics. 2021;19(1):1.
- Raphael E, Gaynes R, Hamad R. Cross-sectional analysis of place-based and racial disparities in hospitalisation rates by disease category in California in 2001 and 2011. BMJ Open. 2019;9(10):e031556.
- Berkowitz SA, Traore CY, Singer DE, et al. Evaluating area-based socioeconomic status indicators for monitoring disparities within health care systems: results from a primary care network. Health Serv Res. 2015;50(2):398-417.