
Original Research
Age-Related Posterior Cruciate Ligament Surgical Anatomy in a Skeletally Immature Population: An MRI Study
1Division of Sports Medicine, Department of Orthopaedic Surgery, Boston Children’s Hospital, Boston, MA; 2Harvard Medical School, Boston, MA; 3Baylor Scott & White Health, Waxahachie, TX
Correspondence: Mininder S. Kocher, MD, MPH, Boston Children’s Hospital, 300 Longwood Ave., Boston, MA 02115. Email: [email protected]
Received: April 19, 2022; Accepted: June 25, 2022; Published: August 1, 2022
DOI: 10.55275/JPOSNA-2022-0085
Volume 4, Number 3, August 2022
Abstract:
Background: Magnetic resonance imaging (MRI) analysis of the developmental morphology of the anterior cruciate ligament (ACL) in pediatric and adult patients has led to the identification of anatomical risk factors for injury and optimization of surgical reconstruction. Similar work regarding the pediatric posterior cruciate ligament (PCL) is limited. The aim of this study was to describe age-dependent changes in ligamentous and osseous anatomy of the pediatric PCL by comparison of MRI measurements.
Methods: Sixty randomly selected patients were categorized into three skeletal age groups (ages 7–9 years, 10–12 years, and 13-15 years) with 20 patients in each. Twelve anatomical dimensions were measured on MRI by two independent reviewers. Pairwise comparisons were conducted between the youngest and intermediate as well as the intermediate and oldest age groups.
Results: Statistically significant growth in femoral physis width (p<0.001), tibial physis width (p<0.001), and medial femoral condyle (MFC) width (p<0.001) and height (p<0.001) was found across all skeletal age groups. Growth in femoral PCL height (p=0.02), femoral PCL footprint to femoral physis height (p=0.004), tibial PCL insertion width (p<0.001), tibial PCL footprint to tibial physis distance (p<0.001), and tibial epiphysis height (p=0.003) and width (p<0.001) was only statistically significant between the youngest and intermediate groups. Only MFC height (p=0.03) and width (p=0.001), femoral PCL height (p=0.05), and tibial physis width (p=0.02) were significantly larger in the oldest compared to the intermediate group. Intrarater reliability for all measurements was excellent; interrater reliability was variable.
Conclusions: Morphological changes of the pediatric PCL and associated surgical anatomy vary by skeletal age throughout childhood and adolescence. Differences were most evident between preadolescents with open physes compared to adolescents with closing physes, who demonstrated slowed or plateaued growth in most dimensions. The femoral physis was located proximal to the origin of the PCL in all age groups. The relationship of the distal PCL footprint to posterior proximal tibial physis varied. Young children (7-9 years) had footprints significantly more distal to the tibial physis, thus, native PCL reconstruction in this age group may be possible. Anatomical reconstruction in adolescents poses greater risk as the PCL footprint is closest to the tibial physis. Analysis of age-dependent transformations of the PCL and surrounding anatomy may inform surgical planning and enhance understanding of physeal location in this active population.
Level of Evidence: Level III – Retrospective Comparative Study
Key Concepts:
- Morphological changes of the pediatric PCL surgical anatomy vary by skeletal age throughout childhood and adolescence.
- Differences were most evident between preadolescents with open physes compared to adolescents with closing physes.
- The femoral physis was located proximal to the origin of the PCL in all age groups.
- The relationship of the distal PCL footprint to posterior proximal tibial physis varied with children having footprints significantly more distal to the tibial physis and adolescents having footprints close to the physis.
Introduction
Childhood and adolescence are characterized by continuous skeletal growth and remodeling, which confer key changes to the osseous and ligamentous anatomy of the knee.1 Developmental changes of the pediatric anterior cruciate ligament (ACL) have been well-documented in recent years.2 Literature characterizing age-dependent morphology of the posterior cruciate ligament (PCL) is sparse in comparison and largely focused on skeletally mature adult populations.1,3
More children are undergoing reconstructive surgery for ligamentous injury at younger ages due to increased injury prevalence and to mitigate the risk of future meniscal and chondral damage. Cruciate ligament reconstruction in skeletally immature patients risks disturbance of open physes causing growth restriction, thus necessitating thorough understanding of surgical anatomy in the developing patient.4–6 Evidence of age-related changes in angularity and size of the PCL tibial attachment site was demonstrated on magnetic resonance images (MRI) of a large cohort of skeletally mature adults. The corresponding quantitative data served as a reference for determining size and position of PCL tunnels during anatomic arthroscopic reconstruction.7 MRI studies have demonstrated increases in PCL angle with physeal fusion and decreasing horizontal component-to-vertical component PCL ratio through skeletal maturation.8,9
Patterns of PCL injury vary with age.10 Intrasubstance ligamentous injury of the PCL is more common in adults. In contrast, the relative incidence of osteochondral avulsions of the PCL attachment is higher for children.11–13 Prior MRI studies have associated distal narrowing of the femoral intercondylar notch with intrasubstance cruciate ligament injury.14,15 Notch width increases until ages 13 to 14 years after which the notch narrows through adolescence and adulthood, which may be a contributing factor predisposing to injury.15–17
Investigation of PCL morphology may elucidate risk factors for PCL injury, pathophysiology of injury pattern, and optimal graft placement during surgical repair. The authors are not aware of prior work that has comprehensively documented developmental changes in PCL morphology assessed on MRI in children and adolescents. The purpose of this study was to utilize MRI measurements to describe age-dependent changes in surgical anatomy of the PCL and their relationship to the immature femoral and tibial physes.
Materials and Methods
Patient Selection
Following institutional review board approval, a single-institution pediatric operative database was queried for skeletally immature patients between 7 and 16 years of age who had undergone 1.5 or 3.0 Tesla MRI of the knee and concurrent wrist radiograph between July 2008 and July 2018 in the setting of suspected ACL injury. Skeletal immaturity was defined by open or closing (i.e., not yet closed) growth plates at one or both of the tibial and femoral physes on knee MRI. Patients were excluded from this study if MRI indicated PCL injury, abnormal morphology of the distal femur or proximal tibia (including, but not limited to, displaced fracture, skeletal dysplasia, prior PCL or ACL reconstruction), or history of prior knee surgery with retained hardware. Application of these criteria resulted in a sample of 373 patients. The cohort was further classified by skeletal age through analysis of wrist x-rays and placed into one of three categories based on skeletal maturity: 1) youngest skeletal age of 7-9 years, 2) intermediate skeletal age of 10-12 years, and 3) oldest skeletal age of 13-15 years. A random number generator was used to randomly select patients from the sample until there were 20 patients within each skeletal age category for a final cohort consisting of 60 patients. Characteristics of each skeletal age group were quantified, including mean skeletal and chronological ages as well as physeal status.
Anatomic Measurements From MRI
Twelve anatomic PCL measurements (7 coronal, 5 sagittal) were obtained from the T2-weighted coronal or sagittal slices from the knee MRI of each patient; STIR or PD FS sequences were used if the T2-weighted sequence was unavailable or indeterminate. Seven parameters were measured from coronal cuts, including femoral physis width, medial femoral condyle (MFC) width, MFC height, femoral PCL height, femoral PCL footprint to femoral physis height, tibial PCL insertion width, and mid-substance PCL width at the joint line (Figure 1). An additional five parameters were measured from a single sagittal cut on each MRI (Figure 2). These parameters included mid-substance PCL width at the joint line, tibial physis width, tibial PCL footprint to tibial physis distance (Figure 3), tibial epiphysis height, and tibial epiphysis width.
Figure 1. Description of parameters evaluated on MRI coronal plane measurements in millimeters (mm): A) femoral physis width, measured as the maximal medial-to-lateral (ML) width; B) medial femoral condyle (MFC) width, measured ML at the level of the midpoint of the MFC (typically the proximal PCL attachment site); C) MFC height, measured PD from physis to subchondral bone; D) femoral PCL height, measured PD from proximal PCL to distal physis; E) femoral PCL footprint to distal femoral physis height, measured PD from distal physis to proximal point of PCL origin; F) tibial PCL insertion width, measured ML at the level of the tibial insertion; and G) mid-substance PCL width, measured ML at the level of the joint line.

Figure 2. Description of parameters evaluated on MRI sagittal plane image measurements in millimeters (mm): A) mid-substance PCL width, measured anterior-to-posterior (AP) at the joint line; B) proximal tibial physis width, measured as maximal AP width; C) tibial PCL footprint to tibial physis distance, measured PD from distal aspect of tibial PCL footprint to proximal aspect of tibial physis (if PCL tibial footprint was distal to the physis, distance was recorded as a negative number); D) tibial epiphysis height, measured PD from the midpoint of the tibia nearest to the PCL tibial attachment; E) tibial epiphysis width, measured AP at the level of the PCL tibial attachment parallel to the physis (as if drilling a tunnel).

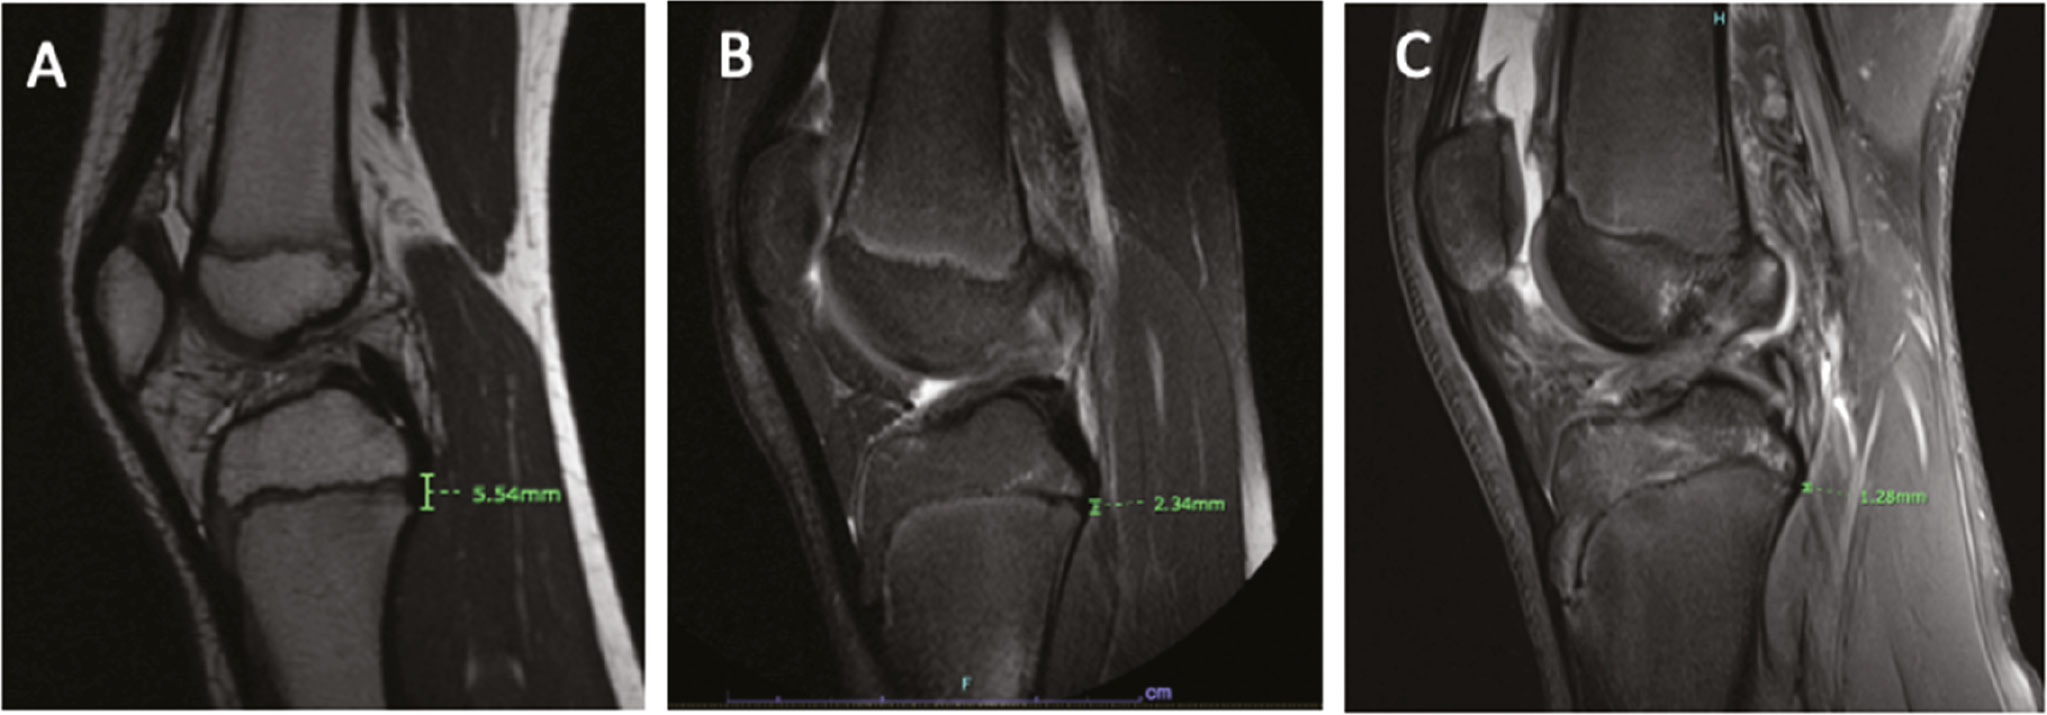
Figure 3. Measurement of distal PCL footprint to proximal tibial physis distance on a magnetic resonance (MR) image for a patient selected from each skeletal age range group: A) 9 years, B) 11 years, and C) 13 years.
Reliability Analysis
Two independent raters (one orthopaedic sports medicine-trained fellow and one orthopaedic surgery resident) performed 12 MRI measurements on all 60 patients. A detailed manual for collecting the MRI measurements was utilized to train both raters. Measurements were repeated by both raters 4 weeks after completion of the initial measurements on a random sample of 46 patients selected from the cohort. Interrater and intrarater reliabilities were calculated for each of the 12 anatomical dimensions. Quantification of interrater reliability was based on the initial round of measurements; intrarater reliability was based on the two measurements separated by 4 weeks. Reliability was assessed by estimating the intraclass correlation coefficient (ICC) along with a 95% confidence interval (CI) for each measurement. Interrater reliability was assessed using an ICC (2,2) model and intrarater reliability was assessed using an ICC (3,1) model. Interpretations of ICC estimates were based on the scale from Fleiss and Cicchetti and Sparrow: <0.40, poor; 0.40-0.59, fair; 0.60-0.74, good; and >0.74, excellent.18,19
Statistical Analysis
Measurements were summarized across skeletal age groups and compared by groups using analysis of variance. Pairwise comparisons were conducted between youngest (7-9 years) and intermediate (10-12 years) skeletal age groups, and intermediate and oldest (13-15 years) skeletal age groups using Tukey’s honest significant difference; only adjusted p-values were reported. P-values less than 0.05 were considered significant. Interquartile ranges (IQR), medians, and outliers were determined for each of the 12 PCL measurements across all three skeletal age groups and displayed as boxplots. All statistical analyses were performed in R version 4.0.1 (R Core Team; Vienna, Austria) using the irr package for reliability analysis and the multcomp package for analysis of variance analyses.20–22
Results
Of the 60 patients in the final sample, 38 (63%) were boys and 43 (72%) had an open physis at the time of MRI. Of the three sub-groups of skeletal age, the youngest group had a mean (±SD) skeletal age of 8.3±0.60 years (range, 7–9 years) and a mean chronological age of 8.4±0.60 years, the intermediate group had a mean skeletal age of 11.3±0.81 years (range, 10–12 years) and a mean chronological age 11.3±1.03 years, and the oldest group had a mean skeletal age of 13.8±0.72 years (range, 13–15 years) and a mean chronological age of 13.6±1.14 years (Table 1). All patients in the youngest group had open physes, 95% (19/20) of the intermediate age group had open physes, and 20% (4/20) of the oldest group had open physes.
Table 1. Cohort Characteristics (N = 60)
| Age Groups (skeletal age) | N | Sex (% male) | Open Physis (% open) | Skeletal Age (years) | Chronological Age (years) | ||||
|---|---|---|---|---|---|---|---|---|---|
| Freq. | (%) | Freq. | (%) | Mean | ± SD | Mean | ± SD | ||
| Youngest (7-9 years) | 20 | 10 | (50%) | 20 | (100%) | 8.3 | ± 0.80 | 8.4 | ± 0.60 |
| Intermediate (10-12 years) | 20 | 15 | (75%) | 19 | (95%) | 11.3 | ± 0.81 | 11.3 | ± 1.03 |
| Oldest (13-15 years) | 20 | 13 | (65%) | 4 | (20%) | 13.8 | ± 0.72 | 13.6 | ± 1.14 |
SD, standard deviation.
Intra- and Interrater Reliability
Intrarater reliability for all 12 PCL measurements was excellent (ICC >0.9) with ICC values ranging from 0.91-0.99 (Table 2). Interrater reliability was similarly excellent for measurements of femoral physis width, MFC width, tibial physis width, and tibial epiphysis width. Otherwise, interrater reliability was good (ICC 0.75-0.9) for MFC height, mid-substance PCL width in coronal plane, and tibial epiphysis height, moderate (ICC 0.50-0.75) for PCL footprint height, PCL footprint to femoral physis height, tibial insertion of PCL width, and mid-substance PCL width in sagittal plane, and poor (ICC<0.5) for PCL footprint to tibial physis distance.
Table 2. Intra- and Interrater Reliability Between Two Data Collectors for All 12 PCL Measurements
| Measurement (mm) | Intrarater (n=92) | Interrater (n=104) | ||
|---|---|---|---|---|
| ICC | (95% CI) | ICC | (95% CI) | |
| Femoral physis width | 0.99 | (0.99-1) | 0.99 | (0.98-0.99) |
| MFC width | 0.98 | (0.97-0.99) | 0.92 | (0.88-0.94) |
| MFC height | 0.97 | (0.96-0.98) | 0.79 | (0.7-0.86) |
| Femoral PCL height | 0.94 | (0.91-0.96) | 0.63 | (0.45-0.75) |
| Femoral PCL footprint to physis height | 0.94 | (0.92-0.96) | 0.62 | (0.43-0.74) |
| Tibial PCL insertion width | 0.96 | (0.95-0.98) | 0.72 | (0.59-0.81) |
| Mid-PCL width; coronal | 0.93 | (0.89-0.95) | 0.75 | (0.63-0.83) |
| Mid-PCL width; sagittal | 0.91 | (0.87-0.94) | 0.57 | (0.36-0.71) |
| Tibial epiphysis height | 0.94 | (0.91-0.96) | 0.83 | (0.75-0.88) |
| Tibial PCL footprint to physis distance | 0.98 | (0.96-0.98) | 0.30 | (-0.03-0.53) |
| Tibial physis width | 0.99 | (0.99-0.99) | 0.97 | (0.95-0.98) |
| Tibial epiphysis width | 0.98 | (0.97-0.99) | 0.96 | (0.94-0.97) |
CI, confidence interval; ICC, intra-/inter-class correlation; MFC, medial femoral condyle; PCL, posterior cruciate ligament.
Femoral Measurements
All 12 MRI measurements involving the osseous and ligamentous relationship between the PCL and femur differed significantly between the youngest skeletal age group (7-9 years) and the intermediate group (10-12 years) (Table 3, Figure 4). The intermediate group had greater femoral physis width (p<0.001), MFC width (p<0.001), and MFC height (p<0.001) when compared to the youngest group. The relationship between the PCL and femur also changed with elongations in femoral PCL footprint height (p=0.02) and femoral PCL footprint to femoral physis height (p=0.004) for the intermediate group.
Table 3. MRI Measurement Summary by Skeletal Age Group
| Measurement (mm) | Ages 7–9 years (n=20) | Ages 10–12 years (n=20) | Ages 13–15 years (n=20) | ||||||||
|---|---|---|---|---|---|---|---|---|---|---|---|
| Mean | ± SD | Range | Pa | Mean | ± SD | Range | Pb | Mean | ± SD | Range | |
| Femoral physis width | 61.1 | ±3.35 | (54.2 - 67.7) | <0.001 | 70.3 | ±5.01 | (63.5 - 85) | 0.04 | 73.7 | ±4.69 | (65.3 - 85.4) |
| MFC width | 21.3 | ±1.77 | (18.7 - 25) | <0.001 | 23.9 | ±3.07 | (20.2 - 30.1) | 0.001 | 26.7 | ±1.95 | (23.6 - 32.2) |
| MFC height | 25.8 | ±2.31 | (21.3 - 29.8) | <0.001 | 31.3 | ±3.23 | (26 - 36.8) | 0.03 | 33.8 | ±3.16 | (27.5 - 40.9) |
| Femoral PCL height | 8.7 | ±1.05 | (7.3 - 11.1) | 0.02 | 8.9 | ±1.62 | (5.9 - 11.6) | 0.05 | 10 | ±1.62 | (7 - 12.6) |
| Femoral PCL footprint to physis height | 11.5 | ±1.41 | (9.1 - 14.1) | 0.004 | 13.6 | ±1.85 | (9.3 - 16.8) | 0.99 | 13.5 | ±2.30 | (9.5 - 19.5) |
| Tibial PCL insertion width | 11.4 | ±1.49 | (8.2 - 14) | <0.001 | 12.7 | ±2.11 | (9.3 - 16.4) | 0.06 | 14.1 | ±1.89 | (10.1 - 17.1) |
| Mid-PCL width; coronal | 10.1 | ±1.24 | (8.1 - 12.6) | 0.27 | 10 | ±2.11 | (6.1 - 13.8) | 0.24 | 10.9 | ±1.62 | (7.5 - 13.2) |
| Mid-PCL width; sagittal | 5.6 | ±0.65 | (4.5 - 6.8) | 0.14 | 6 | ±1.45 | (4.1 - 9.1) | 0.74 | 6.3 | ±0.99 | (4.7 - 8.2) |
| Tibial epiphysis height | 16.1 | ±1.45 | (13.6 - 19) | 0.003 | 18 | ±1.96 | (14 - 21.2) | 0.62 | 18.7 | ±3.50 | (14.4 - 28.7) |
| Tibial PCL footprint to physis distance | -4 | ±1.00 | (-6 - -1.9) | <0.001 | -3.3 | ±1.00 | (-5.4 - -1.9) | 0.07 | -2.5 | ±1.44 | (-4.5 - 2.4) |
| Tibial physis width | 36.7 | ±2.85 | (32.7 - 44.6) | <0.001 | 45 | ±4.99 | (34.6 - 56.7) | 0.02 | 48.8 | ±4.15 | (44.9 - 57.5) |
| Tibial epiphysis width | 36.3 | ±2.87 | (32.1 - 42.6) | <0.001 | 42.9 | ±4.33 | (33 - 50.3) | 0.18 | 45 | ±3.67 | (41.7 - 56.3) |
ap-values represent comparison between young and intermediate age groups and are adjusted using Tukey’s honest significant difference.
bp-values represent comparison between intermediate and oldest age groups and are adjusted using Tukey’s honest significant difference.
Figure 4. Boxplot depicting median, interquartile range, and outliers of osseous and ligamentous measurements of the femur in millimeters (mm) on magnetic resonance imaging (MRI) including A) femoral physis width, B) medial femoral condyle (MFC) width, C) MFC height, D) femoral posterior cruciate ligament (PCL) footprint height, and E) femoral PCL footprint to femoral physis height for three distinct skeletal age groups.
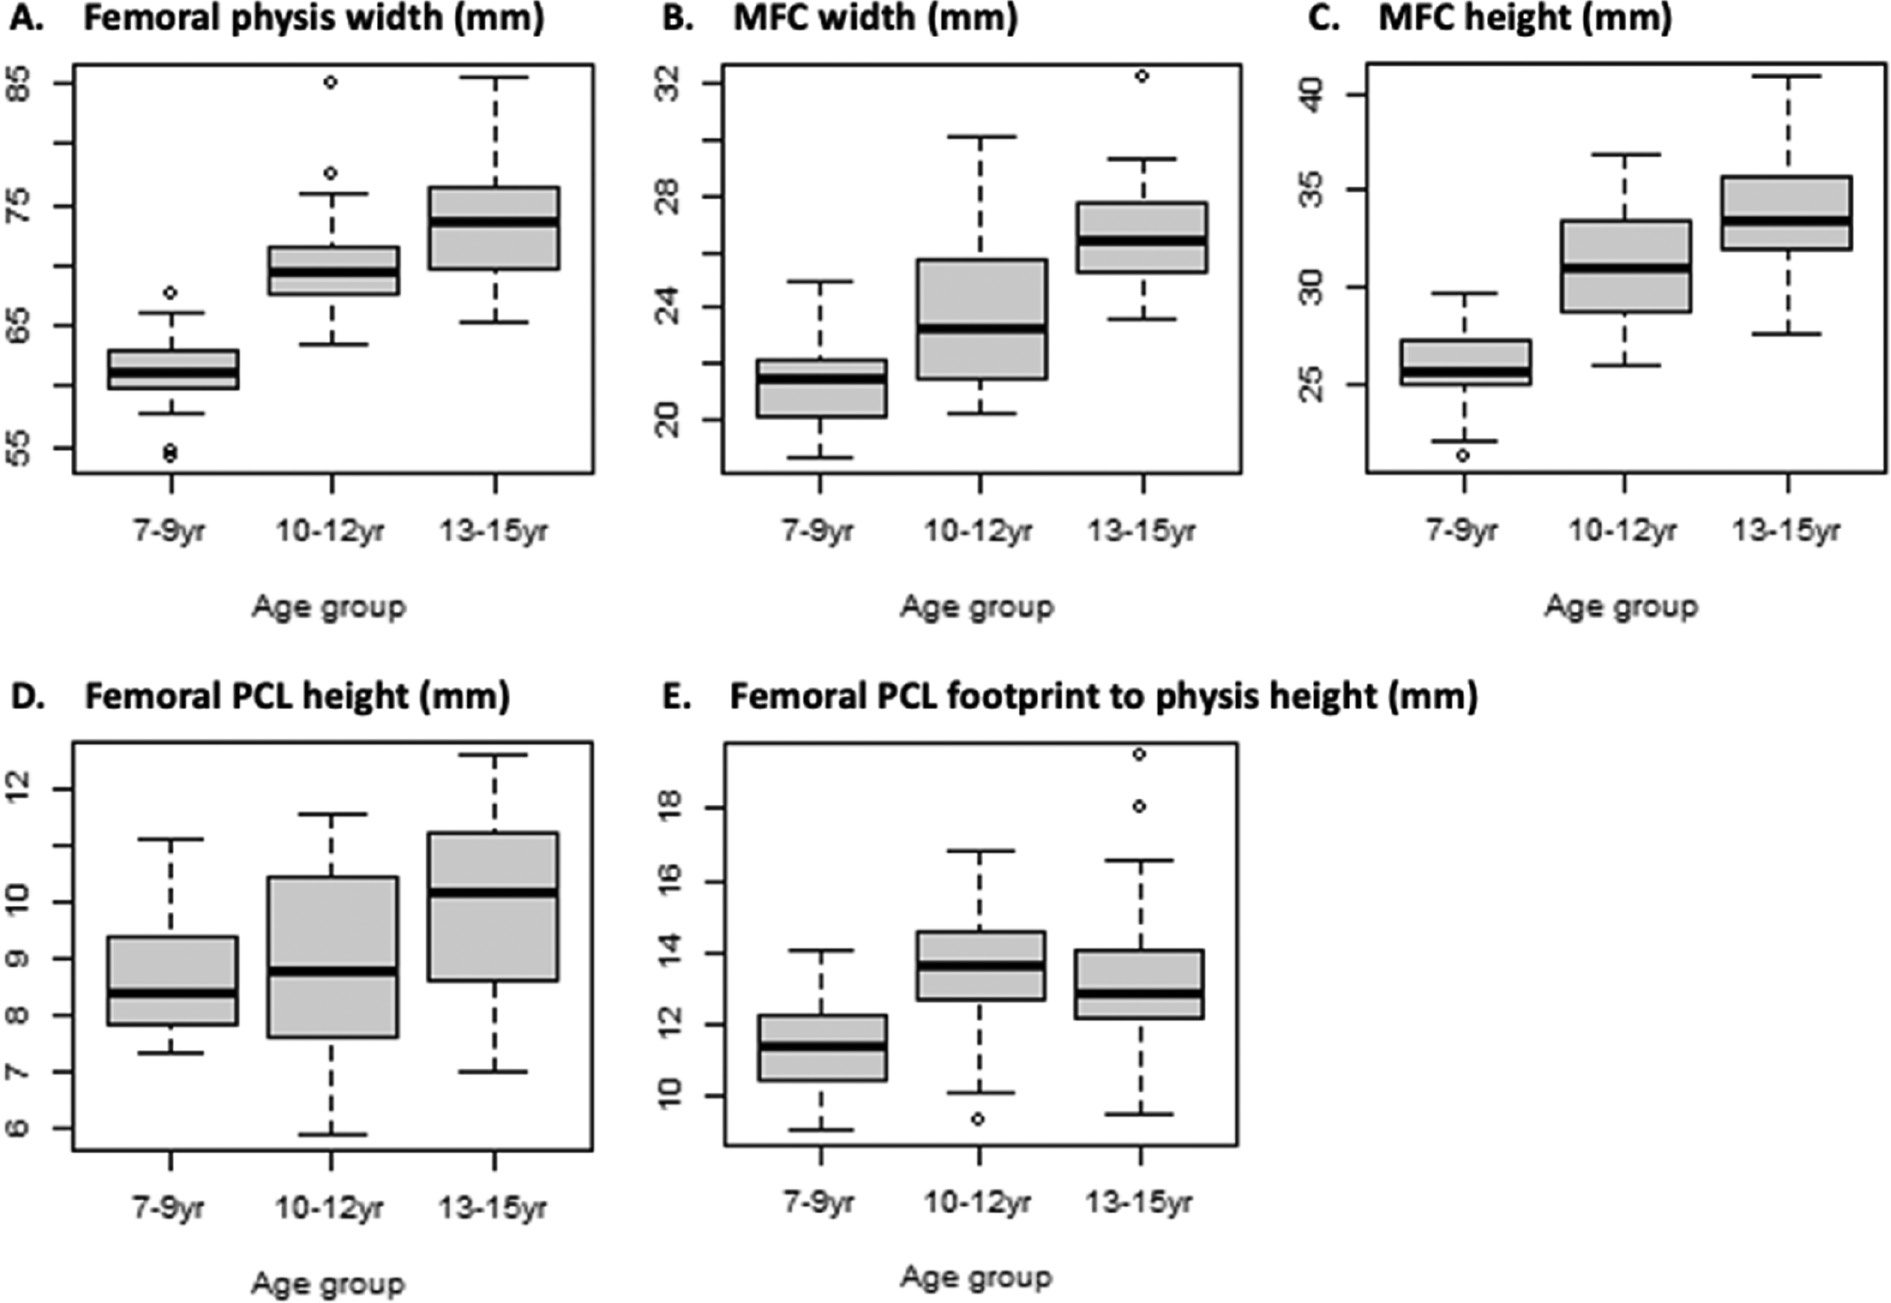
Comparison of the intermediate skeletal age group and the oldest skeletal age group (13-15 years) demonstrated statistically significant differences in size for each osseous femoral landmark associated with PCL development. Femoral physis width (p=0.04), MFC width (p=0.001), and MFC height (p=0.03) were all significantly larger in the oldest age group. There was a lesser degree of change in measurements of the relationship between the PCL footprint and femoral landmarks between the intermediate and oldest groups. The femoral PCL footprint height was slightly greater for the oldest group, but this difference was not statistically significant (p=0.05). There was no difference between the intermediate and oldest groups in measurements of femoral PCL footprint to femoral physis height (p=0.99).
Intraarticular Measurements
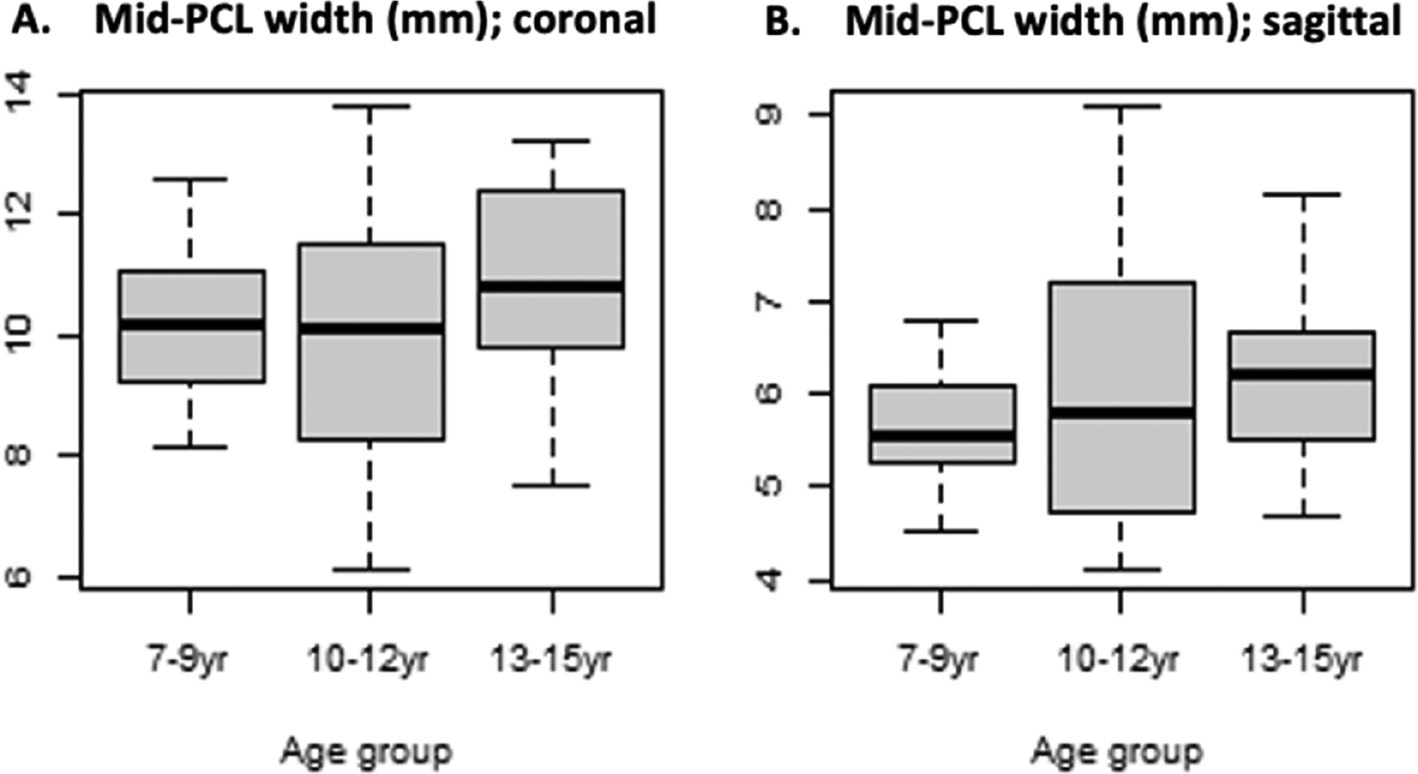
Mid-substance PCL width within the intraarticular space on both the coronal and sagittal MRI planes did not differ significantly between skeletal age groups (Table 3, Figure 5).
Figure 5. Boxplot depicting median, interquartile range, and outliers of mid-substance PCL width in millimeters (mm) within the interarticular space on A) coronal and B) sagittal planes of magnetic resonance imaging (MRI) for three distinct skeletal age groups.
Tibial Measurements
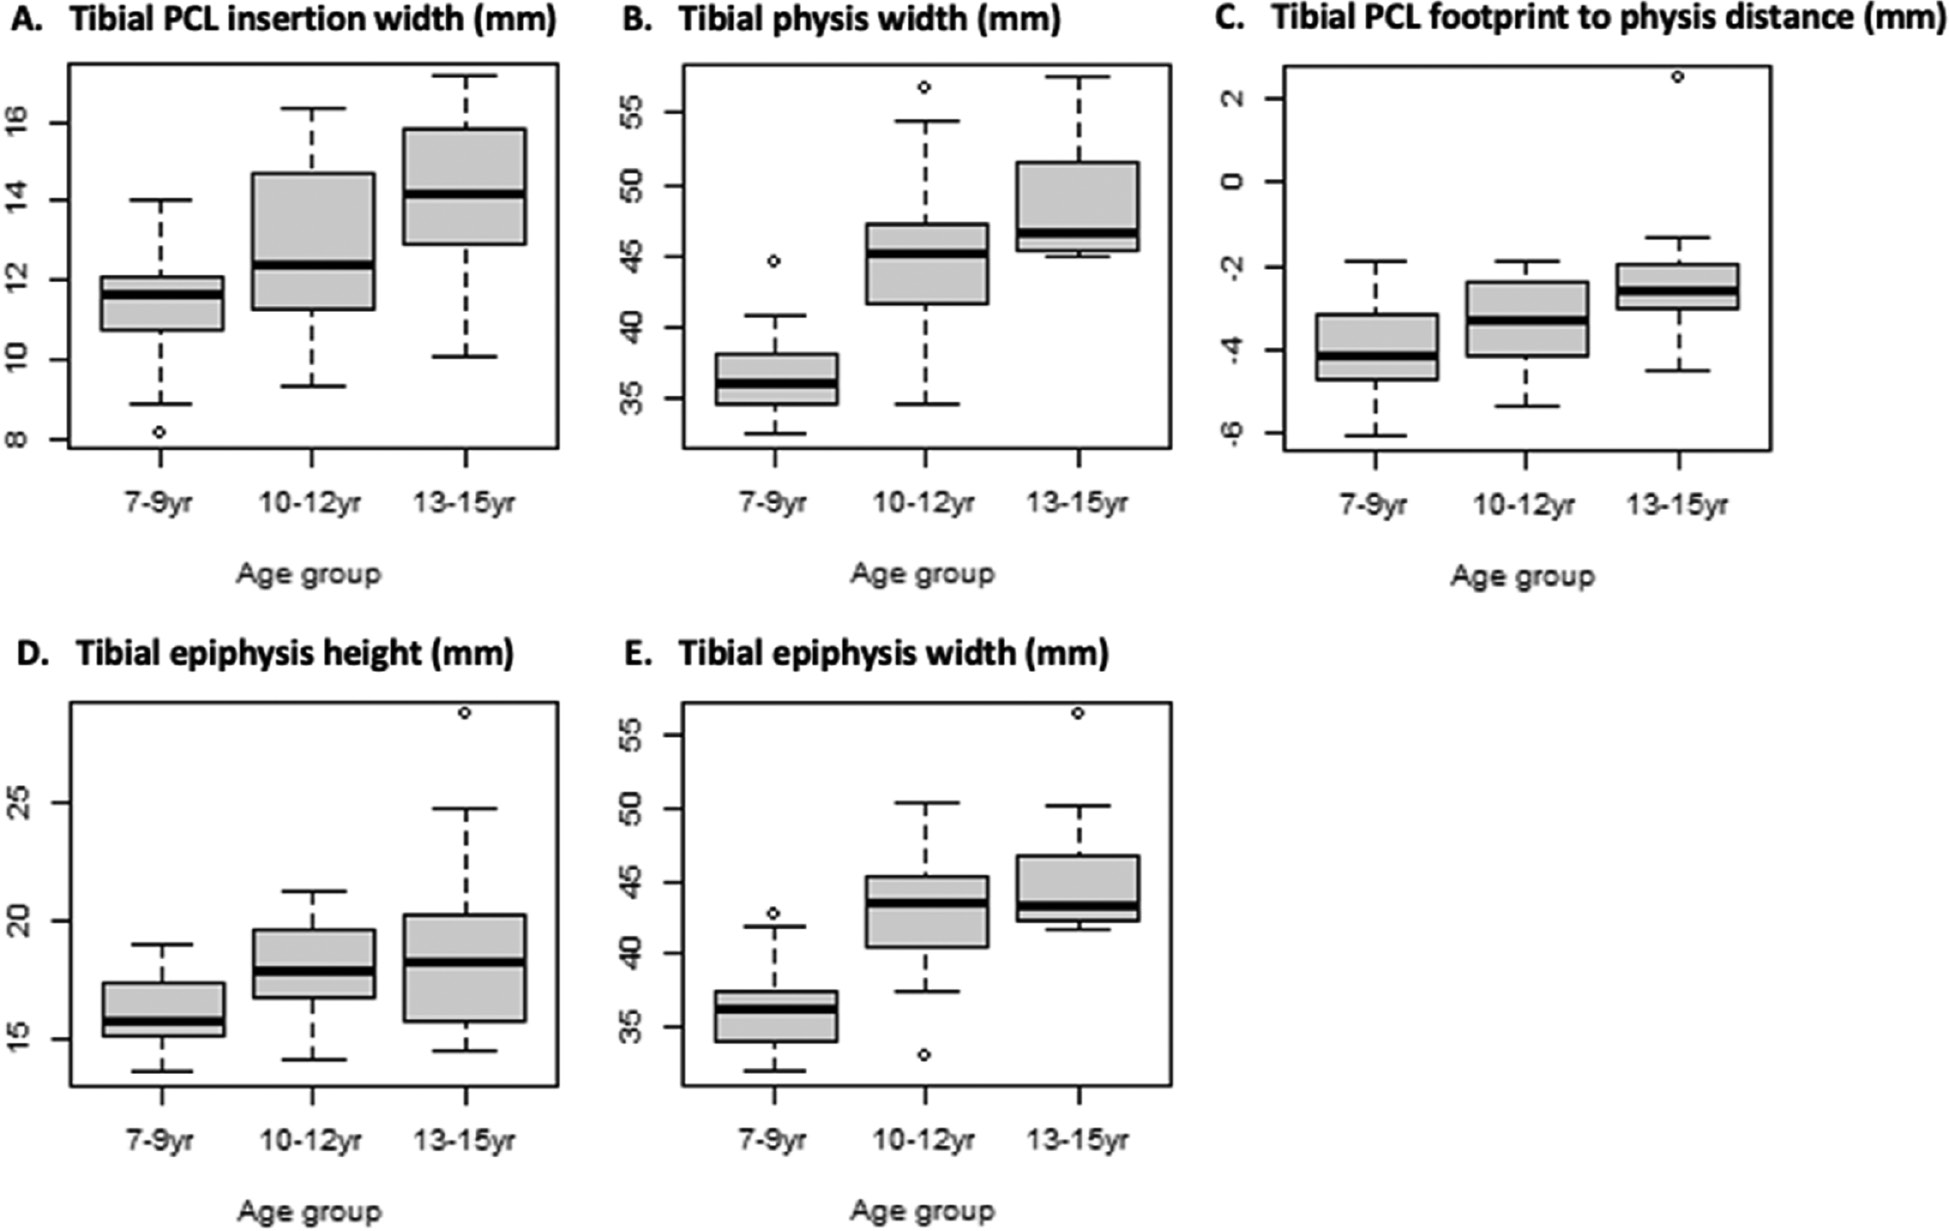
Comparison of the least skeletally mature group (7-9 years) with the intermediate skeletal age group (10-12 years) indicated that the intermediate age group had increases in all osseous tibial measurements during growth: width of tibial PCL insertion (p<0.001), tibial epiphysis height (p=0.003), and tibial epiphysis width (p<0.001) (Table 3, Figure 6). Ligamentous measurements of tibial physis width also increased between these groups (p<0.001), but tibial PCL footprint to tibial physis distance significantly decreased (p<0.001). Fewer differences in tibial measurements were observed between the intermediate and oldest groups, other than a significantly larger tibial physis width (p=0.02) in the more skeletally mature group. Slightly larger measurements of tibial PCL insertion width (p=0.06) and decreased PCL footprint to tibial physis distance (p=0.07) were observed in the oldest compared to the intermediate group that were not statistically significant, while there were no appreciable differences in tibial epiphysis height (p=0.62) and tibial epiphysis width (p=0.18).
Figure 6. Boxplot depicting median, interquartile range, and outliers of osseous and ligamentous measurements of the tibia in millimeters (mm) on magnetic resonance imaging (MRI) including A) tibial PCL insertion width, B) tibial physis width, C) tibial PCL footprint to tibial physis distance, D) tibial epiphysis height, and E) tibial epiphysis width for three distinct skeletal age groups.
Discussion
The present study demonstrated a direct relationship between skeletal age and transitional MRI dimensions of the maturing PCL and its osseous attachments (i.e., femoral origin, tibial insertion) during childhood and adolescence, with the growth rate dependent on skeletal age and anatomical location. These findings provide insight into PCL morphology during critical years of development and may serve as a guide in clinical and surgical management of PCL injuries.
Existing literature on age-related PCL morphology is limited; however, our findings are consistent with the ACL literature. The most distinctive morphological changes in our study occurred between the youngest and intermediate skeletal age groups, with statistically significant growth in all PCL measurements, except mid-substance width. Comparison of the intermediate and oldest skeletal age groups (10-12 years and 13-15 years, respectively) indicated slowing growth with significant growth at the femoral origin and tibial physis only. These findings indicate a relatively rapid phase of growth in ligamentous and osseous PCL morphology in pre-adolescence while physes are still open, followed by a plateau in growth rate upon entering early adolescence as physes begin to close. Putur et al. documented similar, consistent growth in ACL measurements with subsequent plateau at age 11.8 years.3 Lima et al. also noted progressively increasing bicondylar distance during pre-adolescence that plateaued at age 13 years in females and age 15 years in males.16 Kim et al. reported disproportionate lengthening of the PCL with minimal change in width during skeletal maturation.8 We found that femoral PCL height increased significantly with skeletal age, but PCL width in the interarticular space was not age-dependent.
Anatomical positioning of the graft tunnel at the native PCL site has been associated with reduced postoperative complications of laxity and range of motion limitations but may threaten the immature physis.23 Surgical anatomy of the native PCL in relation to the femoral and tibial physis is of particular concern for skeletally immature patients. Several physis-sparing techniques have been identified for ACL reconstruction to accommodate for incremental stages of skeletal maturity but less so for PCL injuries.24 Our study identified important differences in the distances from open femoral and tibial physes to their respective PCL footprints between the youngest and intermediate skeletal age groups. The proximal PCL footprint was found to be increasingly distal to the femoral physis with a subsequent plateau in growth just prior to physeal fusion. This positioning may facilitate PCL reconstruction with an epiphyseal femoral tunnel. The tibial PCL footprint was distal to the tibial physis in all age groups but grew more proximal to the physis with advancing skeletal age. Thus, transtibial tunnel placement in prepubescent patients can allow for anatomic reconstruction entering the joint posteriorly distal to the proximal tibial physis. In adolescent patients, this may be more challenging, as the PCL tibial origin is closer to the posterior proximal tibial physis. Alternative approaches include an open posterior onlay technique with a bone block just distal to the proximal tibial physis.25 The optimal technique for adult PCL reconstruction remains a point of debate as well, with single versus double bundle repair and transtibial tunneling versus tibial inlay being at the forefront.26
There are several limitations to this retrospective, single pediatric institution study. The MRI images were reviewed by only two raters, although rater blinding and an interval of over 1 month between ratings was sought to minimize bias. While intrarater reliability for all 12 PCL dimensions was excellent and interrater reliability generally ranged from moderate to excellent across the measurements, the interrater reliability in tibial PCL footprint to physis distance was poor and ought to be interpreted cautiously. The poor interrater reliability for this distance was likely due to difficulty obtaining a precise measurement of this relatively short anatomical dimension from the available image resolutions. This challenge may have exaggerated very subtle differences in measurement technique between the two raters. The use of both 1.5T and 3.0T MRI types may have also impacted measurements. This analysis was not stratified by sex; rather, we chose to focus solely on skeletal age. However, prior studies have been inconsistent in reporting an association between sex and ligamentous knee measurements.3,8 A similar rationale was used in the decision to not stratify analyses by other potential risk factors, such as height, weight, BMI, activity level, and medical comorbidities. We chose to analyze skeletal age as distinct categories, rather than as a continuous variable, to evaluate general trends across age groups. As such, this study was not designed to detect nuanced growth differences on the interval of distinct years. Lastly, while the use of skeletal age—rather than chronological age—was a strength of our study, it did limit our cohort to patients with concurrent wrist imaging; this may be a source of potential selection bias.
Future studies should collect prospective, longitudinal measurements to describe interval changes in PCL morphology during skeletal maturation. Age-dependent changes in PCL and ACL orientation on MRI of skeletally immature porcine models were found to mirror those of human children of corresponding skeletal age, suggesting a model for further study.8,9
Conclusion
Morphological changes of the pediatric PCL and associated surgical anatomy vary by skeletal age throughout childhood and adolescence. These changes were most pronounced in preadolescents with open physes (ages 7-12 years) compared to adolescents with closing physes (ages 13-15 years), who demonstrated slowed or plateaued growth in most dimensions. The femoral physis was located proximal to the origin of the PCL in all age groups. The relationship of the distal PCL footprint to posterior proximal tibial physis varied. Young children (7-9 years) had footprints significantly more distal to the tibial physis, thus, native PCL reconstruction in this age group through tibial tunneling may be possible. Reconstruction in adolescents poses greater risk as the PCL footprint is closest to the tibial physis. These age-dependent transformations of the PCL and surrounding anatomy may inform surgical planning and enhance understanding of anatomic physeal relationships in this active population.
Data Availability Statement
The data that support the findings of this study are available from the corresponding author, Mininder S. Kocher, MD, MPH, upon reasonable request.
Disclaimer
No funding was received. The authors have no conflicts of interest to disclose pertaining to this manuscript.
References
- Kocher MS, Shore B, Nasreddine AY, et al. Treatment of posterior cruciate ligament injuries in pediatric and adolescent patients. J Pediatr Orthop. 2012;32(6):553–560.
- Fabricant PD, Kocher MS. Management of ACL injuries in children and adolescents. J Bone Joint Surg Am. 2017;99(7):600-612.
- Putur DE, Slaven SE, Niu EL. ACL growth with age in pediatric patients: an MRI study. J Pediatr Orthop. 2020;40(8):438-447.
- Kim YM, Lee CA, Matava MJ. Clinical results of arthroscopic single-bundle transtibial posterior cruciate ligament reconstruction: a systematic review. Am J Sports Med. 2011;39(2):425-434.
- Wegmann H, Janout S, Novak M, et al. Surgical treatment of posterior cruciate ligament lesions does not cause growth disturbances in pediatric patients. Knee Surg Sports Traumatol Arthrosc. 2019;27(8):2704-2709.
- Perkins CA, Willimon SC. Pediatric anterior cruciate ligament reconstruction. Orthop Clin North Am. 2020;51(1):55-63.
- Teng Y, Guo L, Wu M, et al. MRI analysis of tibial PCL attachment in a large population of adult patients: reference data for anatomic PCL reconstruction. BMC Musculoskelet Disord. 2016;17(1):384.
- Kim HK, Laor T, Shire NJ, et al. Anterior and posterior cruciate ligaments at different patient ages: MR imaging findings. Radiology. 2008;247(3):826-835.
- Cone SG, Simpson SG, Piedrahita JA, et al. Orientation changes in the cruciate ligaments of the knee during skeletal growth: a porcine model. J Orthop Res. 2017;35(12):2725-2732.
- Schmidt EC, Chin M, Aoyama JT, et al. Mechanical and Microstructural Properties of Native Pediatric Posterior Cruciate and Collateral Ligaments. Orthop J Sports Med. 2019;7(2):2325967118824400.
- Anderson AF, Anderson CN. Posterior cruciate and posterolateral ligament reconstruction in an adolescent with open physes. A case report. J Bone Joint Surg Am. 2007;89(7):1598-1604.
- Kim SJ, Jo SB, Kim SG, et al. Peel-off injury at the tibial attachment of the posterior cruciate ligament in children. Am J Sports Med. 2010;38(9):1900-1906.
- Katsman A, Strauss EJ, Campbell KA, et al. Posterior cruciate ligament avulsion fractures. Curr Rev Musculoskelet Med. 2018;11(3):503-509.
- Kocher MS, Mandiga R, Klingele K, et al. Anterior cruciate ligament injury versus tibial spine fracture in the skeletally immature knee: a comparison of skeletal maturation and notch width index. J Pediatr Orthop. 2004;24(2):185-188.
- Hirtler L, Röhrich S, Kainberger F. The femoral intercondylar notch during life: an anatomic redefinition with patterns predisposing to cruciate ligament impingement. AJR Am J Roentgenol. 2016;207(4):836-845.
- Lima FM, Debieux P, Aihara AY, et al. The development of the intercondylar notch in the pediatric population. Knee. 2020;27(3):747-754.
- Domzalski ME, Keller MS, Grzelak P, et al. MRI evaluation of the development of intercondylar notch width in children. Surg Radiol Anat. 2015;37(6):609-615.
- Cicchetti DV, Sparrow SA. Developing criteria for establishing interrater reliability of specific items: applications to assessment of adaptive behavior. Am J Ment Defic. 1981;86(2):127-137.
- Fleiss JL. Statistical Methods for Rates and Proportions. New York: Wiley; 1981.
- Package ‘irr’: Various Coefficients of Interrater Reliability and Agreement. R package version 0.84.1. 2019. Available at: https://CRAN.R-project.org/package=irr.
- Hothorn T, Bretz F, Westfall P. Simultaneous inference in general parametric models. Biom J. 2008;50(3):346-363.
- R Core Team. R: A language and environment for statistical computing. R Foundation for Statistical Computing, Vienna, Austria. 2020. Available at: https://www.R-project.org/.
- McGuire DA, Hendricks SD. Comparison of anatomic versus nonanatomic placement of femoral tunnels in achilles double-bundle posterior cruciate ligament reconstruction. Arthroscopy. 2010;26(5):658-666.
- DeFrancesco CJ, Storey EP, Shea KG, et al. Challenges in the management of anterior cruciate ligament ruptures in skeletally immature patients. J Am Acad Orthop Surg. 2018;26(3):e50-e61.
- Khakha RS, Yasen SK, Wilson AJ. Paediatric physeal sparing posterior cruciate ligament (PCL) reconstruction with parental donation allograft: rationale and operative approach. Knee. 2018;25(1):203-209.
- Bedi A, Musahl V, Cowan JB. Management of posterior cruciate ligament injuries: an evidence-based review. J Am Acad Orthop Surg. 2016;24(5):277-289.